ၾၢႆႇ:Standard deviation diagram.svg

Size of this PNG preview of this SVG file: 400 × 200 ၽိၵ်ႉသႄႇလ်. resolutionsတၢင်ႇဢၼ် : 320 × 160 ၽိၵ်ႉသႄႇလ် | 640 × 320 ၽိၵ်ႉသႄႇလ် | 1,024 × 512 ၽိၵ်ႉသႄႇလ် | 1,280 × 640 ၽိၵ်ႉသႄႇလ် | 2,560 × 1,280 ၽိၵ်ႉသႄႇလ် ။
ၾၢႆႇငဝ်ႈတိုၼ်း (ၾၢႆႇ SVG, ၸိုဝ်ႈ 400 × 200 pixels, သႅၼ်းၾၢႆႇ : 17 KB)
ၵႂၢမ်းယေႃး
| ၶေႃႈသပ်းလႅင်း |
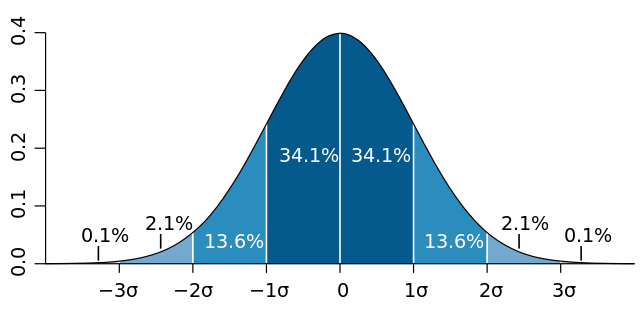
English: Normal distribution curve that illustrates standard deviations. Each band has 1 standard deviation, and the labels indicate the approximate proportion of area (note: these add up to 99.8%, and not 100% because of rounding for presentation.)
Français : Courbe de distribution normale montrant l'écart type. Chaque bande verticale a une largeur d'un écart type et les pourcentages indiquent leur valeur approximative rapportée à la population totale. Note : du fait des arrondis, le total est de 99,8 % au lieu de 100%. |
| ဝၼ်းထီႉ | |
| ငိူၼ်ႈငဝ်ႈတိုၼ်း | ၵၢၼ်ၶွင်တူဝ်, based (in concept) on figure by Jeremy Kemp, on 2005-02-09 |
| ၽူႈတႅမ်ႈလိၵ်ႈ | M. W. Toews |
| Other versions |
|
.svg)
ဝ်ႂ
This file is licensed under the Creative Commons Attribution 2.5 Generic license.
- ၸဝ်ႈၵဝ်ႇထၢင်ႇႁၢင်ႈ
- တႃႇၽႄၸႂ်ႉ – တွၼ်ႈတႃႇထုတ်ႇဢဝ်၊ ပိုၼ်ၽႄႈ လႄႈ ပိုၼ်ဢွၵ်ႇပၼ် ၼႃႈၵၢၼ်။
- ၶိုၼ်းထႅမ်သႂ်ႇ – မႄးထွင်ၵၢၼ် ႁႂ်ႈသၢင်ႇထုၵ်ႇ
- ၸွမ်းၼင်ႇ သၢႆႇငၢႆတီႈတႂ်ႈၼႆႉ
- ႁၢင်ႈၽၢင်ၶဝ်ႈပႃး – ၸဝ်ႈၵဝ်ႇတေလႆႈမွၵ်ႇပၼ်ၸိုဝ်ႈ ဢၼ်သၢင်ႇထုၵ်ႇ တွၼ်ႈတႃႇ ႁဵင်းၵွင်ႉ ဢၼ်ၵမ်ႉထႅမ်ပၼ် ဝႂ်ၶႂၢင်း လႄႈ သင်ၸိူဝ်ႉဝႃႈ လႆႈမီးလွင်ႈလႅၵ်ႈလၢႆႈမႃးၼႆ ၶႅၼ်းတေႃႈ ၸီႉၼႄပၼ်သေၵမ်း။ ၸဝ်ႈၵဝ်ထုၵ်ႇလီႁဵတ်း ႁႂ်ႈပဵၼ်တၢင်းႁဵတ်းသၢင်ႈ မီးလွင်ႈမီးတၢင်းမၼ်း၊ ၵူၺ်းၵႃႈဝႃႈ မၼ်းဢမ်ႇမၢႆထိုင်ဝႃႈ ဝႂ်ၶႂၢင်းၼၼ်ႉ မၼ်းတေပဵၼ် ဢၼ်ၸွႆႈဢၼ်ၵမ်ႉထႅမ်ပၼ် ၸဝ်ႈၵဝ်ႇ ဢမ်ႇၼၼ် ဢၼ်ၸဝ်ႈၵဝ်ႇၸႂ်ႉဝႆႉၼၼ်ႉ။
ပိုၼ်းၾၢႆႇ
တဵၵ်းၼိူဝ် ဝၼ်းထိ/ၶၢဝ်းယၢမ်း တႃႇႁၼ်ၾၢႆႇ ၼႂ်းဝၼ်းၼၼ်ႉ
| ဝၼ်းထီႉ/ၶၢဝ်းယၢမ်း | ႁၢင်ႈလဵၵ်ႉ | သႅၼ်းမၼ်း | ၽူႈၸႂ်ႉတိုဝ်း | တၢင်းႁၼ်ထိုင် | |
|---|---|---|---|---|---|
| ယၢမ်းလဵဝ် | 02:06, 15 ၸၼ်ႇဝႃႇရီႇ 2015 | | 400 × 200 (17 KB) | GliderMaven | Average is now zero not mu |
| 11:08, 7 ဢေႇပရႄႇ 2007 |  | 400 × 200 (14 KB) | Petter Strandmark | == Summary == Standard deviation diagram, based an original graph by Jeremy Kemp, in 2005-02-09 [http://pbeirne.com/Programming/gaussian.ps]. This figure was started in R using: <pre> x <- seq(-4,4,.1) plot(x,dnorm(x),type |
လွင်ႈၸႂ်ႉတိုဝ်း ၾၢႆႇ
ၼႃႈလိၵ်ႈ ၵွင်ႉမႃးၸူးၾၢႆႇၼႆႉ:
လွင်ႈၸႂ်ႉတိုဝ်းၾၢႆႇလူမ်ႈၽႃႉ
Wikis ၸိူဝ်းဢၼ်ၸႂ်ႉဝႆႉ ၾၢႆႇဢၼ်ၼႆႉ:
- ၸႂ်ႉဝႆႉ af.wikipedia.org
- ၸႂ်ႉဝႆႉ ar.wikipedia.org
- ၸႂ်ႉဝႆႉ ast.wikipedia.org
- ၸႂ်ႉဝႆႉ as.wikipedia.org
- ၸႂ်ႉဝႆႉ ba.wikipedia.org
- ၸႂ်ႉဝႆႉ be-tarask.wikipedia.org
- ၸႂ်ႉဝႆႉ bew.wikipedia.org
- ၸႂ်ႉဝႆႉ bg.wikipedia.org
- ၸႂ်ႉဝႆႉ bn.wikipedia.org
- ၸႂ်ႉဝႆႉ bs.wikipedia.org
- ၸႂ်ႉဝႆႉ ca.wikipedia.org
- ၸႂ်ႉဝႆႉ cbk-zam.wikipedia.org
- ၸႂ်ႉဝႆႉ cs.wikipedia.org
- ၸႂ်ႉဝႆႉ cv.wikipedia.org
- ၸႂ်ႉဝႆႉ cy.wikipedia.org
- ၸႂ်ႉဝႆႉ dag.wikipedia.org
- ၸႂ်ႉဝႆႉ da.wikipedia.org
- ၸႂ်ႉဝႆႉ de.wikipedia.org
- ၸႂ်ႉဝႆႉ de.wikiversity.org
- ၸႂ်ႉဝႆႉ el.wikipedia.org
- ၸႂ်ႉဝႆႉ en.wikipedia.org
တူၺ်း ၾၢႆႇmore global usage ဢၼ်ၼႆႉ